The new Trump administration will certainly change the economic picture for the U.S. But not as much as the president-elect’s supporters or detractors may think, according to Chapman University President Emeritus Jim Doti.
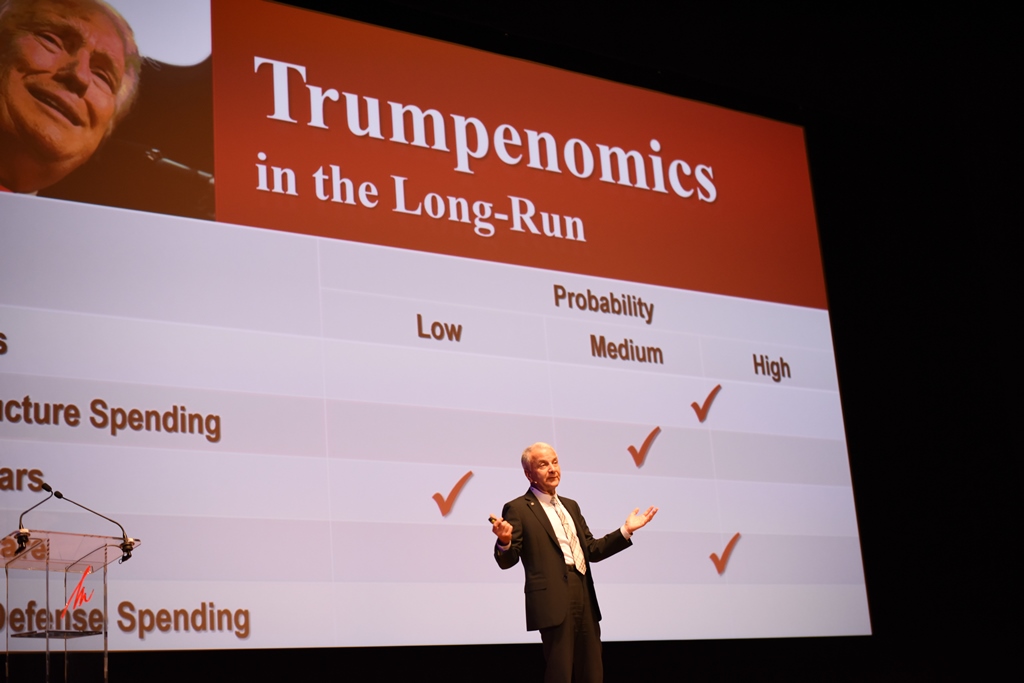
Doti opened the 39th Annual Economic Forecast with a “Trumpenomics” prologue in which he predicted that the president-elect’s plans will be moderated.
“On trade wars, our rating of likelihood is very low, in spite of the vitriol regarding NAFTA and the Trans-Pacific Partnership. I really believe they are so interconnected to global trade, particularly NAFTA,” he said. “I think there will be some jawboning and maybe some things will have to be given back … but no major significant changes.”
However, the new administration likely will win corporate tax cuts and increased spending on defense and infrastructure, Doti said.
Overall, the forecast sees continued growth both in California and the U.S., with real GDP growing from 1.6 percent in 2016 to 2.4 percent in 2017.
The Chapman Econometric Model was inaugurated in 1978 as a faculty-student research project. Since that time, faculty and students of the George L. Argyros School of Business and Economics have maintained and regularly updated the model.
The forecast was presented in Musco Center for the Arts before an audience of nearly 1,000 business and community leaders. Following is a summary of the full presentation.
Forecast overview
President-elect Trump’s campaign proposals will change our nation’s economic landscape. In the long-run, “Trumpenomics” is likely to bring about regulatory reform, tax cuts, increased spending on defense and infrastructure, and some sort of Obamacare “fix.” Trumpenomics in the short-run points to the reversal of executive orders, investment decisions being held back, loosened bank regulations and expectations of inflation.
With tax cuts and increased spending looming, the Federal Reserve Board is likely to be more resolute than ever about raising the federal funds rate, which is likely, in turn, to push up other short-term interest rates. If that were to narrow the difference between short- and long-term rates, it may be a warning of recession. Every recession has been preceded by the interest rate spread (the difference between the 10-year T-bond and the 90-day T-bill) falling below zero.
There is no reason to believe in the coming year that the interest rate spread will turn negative. Not only do these findings rule out a recessionary call, but we are forecasting that the recovery will pick up steam, with real GDP growth increasing from 1.6 percent in 2016 to 2.4 percent in 2017.
Highlights
- Payroll employment is forecasted to increase 1.8 percent in 2017—the same as the growth rate registered this year. This sustained job growth, coupled with higher wage gains, will push consumer spending higher.
- In addition, sharp increases in household wealth, fueled by stock market gains and rising home prices, will help spur higher consumer spending.
- Investment in mining exploration and wells dropped sharply from $123 billion in 2015 to $42 billion in 2016. We believe this sector has now bottomed out, and the lifting of its drag on the overall economy has helped real GDP growth gain momentum.
- Higher investment spending will also be fueled by a pickup in housing starts. That increase will lead to 1.2 million housing starts in 2017—the highest since the recovery began but still below the pre-recession high of 2.1 million housing starts in 2005.
- Despite the projected increase in residential construction, home price appreciation is forecasted to slow from 5.5 percent in 2016 to 5.0 percent in 2017.
- Inflation, as measured by the year-to-year change in the personal consumption expenditures price index, less food and energy, is forecasted to be on the rise by mid-2017, increasing from 1.7 to 1.9 percent by year-end.
- Both short-and long-term interest rates are forecasted to increase about 50 basis points by the end of 2017, keeping the interest rate spread positive at about 200 basis points.
2017 California Forecast
Since 2017, California has outperformed the nation in job growth. That is due, in large part, to the Silicon Valley’s disproportionately high growth in job numbers and wage/salary levels in the high-paying information services sector. But growth in those jobs has dropped back sharply since early last year, and a number of factors suggest a continuing downward spiral, albeit at a slower rate. This Silicon Valley slowdown will have a significant impact on the state’s overall economy.
Another factor expected to constrain job growth in California next year is a slowdown in construction, with total building permit valuation declining from a 4.1 percent growth rate in 2016 to 3.2 percent in 2017.
Our Chapman model suggests that these negative forces will be offset, in part, by stronger growth in real GDP and imports into California. While imports are subtracted from U.S. real GDP growth, they serve as a positive proxy for the extensive trade and distribution services in California. Barring any Trump-induced changes in trade pacts and tariffs, at least in 2017, the recent depreciation in exchange rate values points to a pickup in imports flowing through California from the state’s major markets, China, Mexico, Japan and Canada.
Our forecast calls for employment growth in the state to slow from 2.5 percent in 2016 to 2.1 percent in 2017. While we see California job growth slowing to 2.1 percent next year, this will still outpace our U.S. forecast of 1.8 percent job growth.
Highlights
- Construction has been a major engine of economic growth in the state since the beginning of the recovery. Annual housing construction has increased sharply from 36,000 units in 2009 to 94,000 in 2016—a 14.5 percent average annual rate of increase.
- Despite this rapid increase in housing construction, the supply is still tight. Population demographics point to the need for 98,000 new units annually between 2015 and 2020, close to the actual number of housing starts occurring annually since 2015.
- Housing affordability in California has hovered around an index of 90 for the last few years, suggesting that median family income is 90 percent of what is required to purchase a medianpriced home. If our forecasts for mortgage rates and housing appreciation in the state are on target, housing affordability will decline from an index of 95 to 84 by the end of next year.
- Another factor that has been and will continue to impact the California economy is migration trends. People are “voting with their feet” and moving outside the state. From 2010 to 2014, California lost 88,000 citizens as compared with Texas and Florida that both gained more than 100,000.
Orange County Forecast
From 2012 to 2016, the average annual percentage increase in jobs was 2.7 percent in both Orange County and California. But there are structural differences in the engines of growth. Orange County exceeded California in job growth in construction and financial activities. But Orange County actually lost several thousand manufacturing jobs, while California gained 31,000. California’s greater strength, however, is explained by the fact that about half of the new manufacturing jobs were in the Silicon Valley. Similarly, California’s job growth in the information services sector was more rapid in Orange County’s.
Overall, we are forecasting that Orange County will outperform both the state and the nation, with 2.5 percent job growth in 2017.
An area of concern for Orange County’s future is the continuing decline in housing affordability. This problem can be seen clearly in the ratio of median home price to median income. In 2016, Orange County’s ratio of 8.3 is extraordinarily high as compared with the U.S. ratio of 3.3 and even California’s ratio of 6.0. And given our forecasts for higher mortgage rates as well as housing appreciation near 6 percent in Orange County next year, we see this affordability gap widening in 2017.
Are current housing prices in the county in “bubble” territory? We believe so. We do not, however, expect that inflating bubble to burst in 2017. Even though mortgage rates are increasing, the tight supply of unsold housing, coupled with strong rental demand, will keep prices appreciating.
Highlights
- Looking to 2017, construction will continue to be particularly important to the county, not only in terms of job growth but also in helping prop up personal income growth. We see Orange County construction jobs increasing 6.0 percent in 2017, well over the 2.4 percent growth forecasted for California. But the forecasted increase of 6.0 percent is lower than the 2016 growth rate of 12.7 percent.
- Housing permits in the county have hovered in a narrow 10,500 to 11,500 range from 2013 to the present. Current demographic trends suggest that demand will remain close to that rate through the year 2020.
- In the largest jobs category, services, our 2017 forecast calls for Orange County growth of 3.3 percent versus 2.9 percent for California.
- The only affordable way for many lower-income families to find housing in the county is through rental housing. Rental units as a percentage of total housing unit permits increased from 60.4 percent in 2012 to 66.9 percent in 2016. Strength in apartment construction will continue to buoy residential permit value next year. We project that total Orange County residential permit valuation will surpass $3 billion for the first time ever in 2017.
- As growth in Orange County’s construction sector slows, we see the positive gap in the county’s job creation versus the U.S. and California narrowing.
- The return on apartment investments decreased in 2016 to near 4 percent. With interest rates projected to increase in 2017, the gap between apartment and interest rates will narrow to only about 100 basis points. Such a narrowing will limit loan funds available for apartment construction.
- Another concern for Orange County is income growth. From 2010 to 2015, Orange County’s per capita personal income grew 16.1 percent, from $49,700 to $57,700. This compares with California’s increase of 25.2 percent, from $43,200 to $54,100. Orange County’s underperformance in creating high-paying information services jobs and more rapid increases in low-paying jobs in the leisure and hospitality sector help explain this difference. The county’s strong performance in construction served to narrow the income growth differential.
The Chapman Econometric Model was inaugurated in 1978 as a faculty-student research project. Since that time, through the A. Gary Anderson Center for Economic Research, faculty and students of the George L. Argyros School of Business and Economics have maintained and regularly updated the model and disseminated the results of their research to the business community.