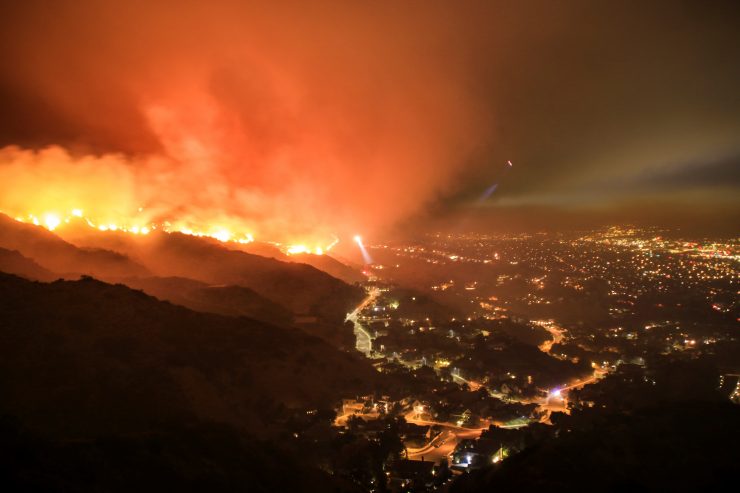
In 2018, California experienced the deadliest, most destructive wildfire season in its history, burning a staggering 1.8 million acres. More than 100 people died.
Now Chapman University researchers at the Center of Excellence in Earth Systems Modeling and Observations (CEESMO) are at the forefront of innovative research to help first responders and decision-makers better prepare for wildfires and take the right action during emergencies.
Their tool of choice: social media.
Shenyue Jia, Ph.D., a postdoctoral researcher at Chapman, became a pilot user of Facebook’s Disaster Maps prototype platform. The program charts evacuation patterns based on time and can tell researchers key information about behavioral responses to evacuation announcements.
Soon after starting at Chapman, Jia had her first-ever experience of evacuating her home during the Canyon Fire 2, which broke out on Oct. 9, 2017, and consumed 9000 acres of brush near Anaheim. “The air pollution even caused a two-day campus closure at Chapman’s Orange campus. It was alarming to say the least,” says Jia.
“It is very important to know how people move during an emergency if we want to make this easier,” says Jia, “Besides social media, I cannot think of a better way to capture people’s real-time action during an evacuation.”
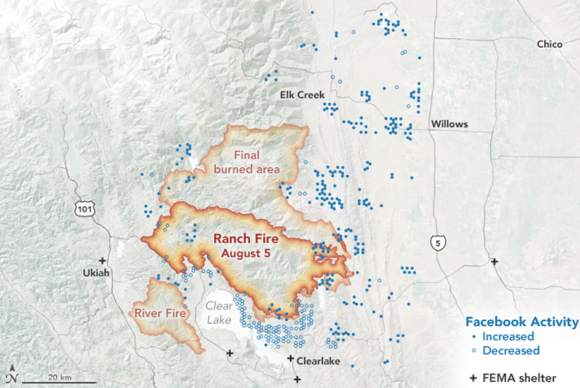
Working with her supervisors at CEESMO, Professor Menas Kafatos, Ph.D., and Seung Hee Kim, Ph.D., as well as an external collaborator, Son V. Nghiem, Ph.D., from NASA JPL, Jia’s research focuses on the Mendocino Complex fire, the largest fire in California’s history that broke out on July 28, 2018.

We asked Jia a few questions about the impact of their research:
First, how does it work? What kind of data is used from social media?
We want to analyze evacuation patterns and factors that can influence the speed of evacuations during a crisis. I’m working with a project called “Disaster Maps” through the Facebook “Data for Good” initiative. The project generates a population map every eight hours at 1 km resolution in the area where a major natural disaster occurs, like wildfires, earthquakes, floods, and hurricanes. The map can capture the near real-time speed, direction, and extension of the population movement during the crisis.
Do people have to have Facebook open in order for their location to be tracked? Are there any issues with privacy?
Amid the recent user-data abuse scandals, social media giants like Facebook not only improved the transparency in the location sharing strategy but also launched initiatives to show the possibility of using geolocation data they have collected “for good.”
The population reported in these maps is calculated using the geolocation data collected from users who allow the location-sharing service while using the Facebook App, or from the voluntarily-reported data through Facebook Safety Check.
How does this research account for people who don’t use Facebook?
Facebook “Disaster Maps” only pick up a small portion of the total population affected. In this case, the oldest and youngest groups are much underrepresented, as well as those who don’t use Facebook. In spite of this bias, Facebook’s user pool is still large enough to detect major changes of the entire community.
How do these population maps reveal people’s action during evacuations?
We want to understand how people react to a mandatory evacuation order in time and space so we layered maps that chart time and space. The stack of the maps is like a magic cube with levels. The height is the time. The two edges at the bottom are latitudes and longitudes.

So, every block of the magic cube represents the population at a certain time and location. This magic cube contains rich information on population change and was then used to identify major drops and climbs of the population during the Mendocino Complex fire.
What are the most striking findings in how people behave during an evacuation?
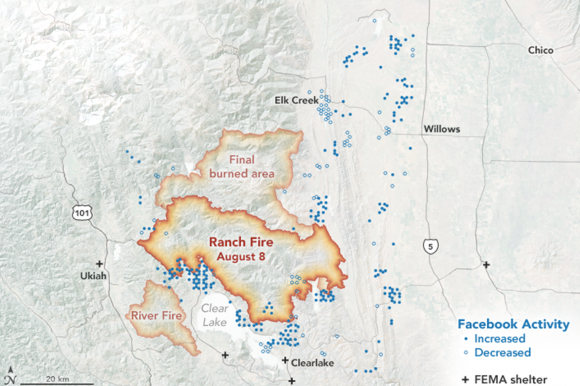
The most prominent pattern we have found was that the greatest drops and climbs in population over time matched the time when mandatory evacuation orders were placed and lifted near the fire perimeter. Not surprisingly, the greatest and the fastest drop of population occurred inside the evacuated areas. However, there was not a large cluster of population increase outside these evacuated areas, or even near the FEMA shelters opened during the emergency. I think this was because of the various options people may have when choosing where to stay during an evacuation.
Is there a similar pattern of population movement after the evacuation orders are lifted?
The returning speed greatly depends on the damage in the community. In the evacuated area of Mendocino Complex fire, the population increased significantly once the evacuation orders were lifted, but this increase was slower than the rapid drop during the evacuation. A wave of population return is expected if the fire damage was better controlled. If you don’t see a major wave of population return after the containment of the fire, that means the evacuated area was badly destroyed.
What do you and the research team hope to accomplish with your work and what impact would you like it to have?
The next step is to study the reasons why some areas were evacuated or why some areas bounced back at a slower rate than others. Factors like fire severity, accessibility to the transport system, population density, demographic composition, and home ownership all add together to define the speed of population movement during the emergency.
We will take into consideration all of these factors and produce a map of the potential population movement speed for fire-prone areas. This map can help first responders and decision-makers improve their preparedness before a fire and take the right action during an emergency.
Jia received her Ph.D. from UCLA Department of Geography. She’s an enthusiast of geospatial technology and has shared her knowledge on using GIS to analyze and solve real-world problems during the open house of Chapman Tech Hub and Summer Academy on Teaching by Institute for Excellence in Teaching and Learning (IETL).
Jia will present her work during the Esri User Conference, July 8 through 12, in San Diego. Esri is the world’s largest leading company for Geographical Information System (GIS) software and solutions.
Display image at top/Getty Images