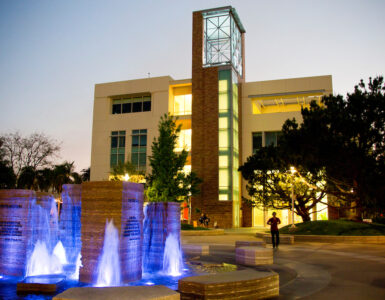
President Jim Doti reports on an Anderson Center study in ‘Business Officer’ magazine.
An article written by President Jim Doti, Ph.D., president of Chapman University, titled
Net Asset Growth in Higher Education
, has been published in the November 2013 issue of
Business Officer
– a magazine of the National Association of College and University Business Officers.
The article presents the results of a study conducted at the A. Gary Anderson Center for Economic Research at Chapman University. The study analyzes changes in the net assets of colleges and universities over a 10-year period, 2000 to 2010. The analysis uses data available through the Integrated Postsecondary education Data System (IPEDS) for 251 four-year and above independent colleges and universities that had net assets greater than $100 million in 2000.
The results show that net assets increased at an average annual rate of 3.2 percent between 2000 and 2010, in spite of a sharp decline of 20 percent in 2009 during the trough of the Great Recession.
Other findings include the following average levels and average annual percentage changes per full-time equivalent (FTE) student:
|
Average Levels and Changes per FTE Student
|
|||
|
Level
|
Average Annual
|
||
| Category |
2000
|
2010
|
2000 to 2010
|
| Number of FTE Students | 4,567 | 5,373 |
1.6%
|
| Tuition and Fees | $19,471 | $32,974 |
5.4%
|
| Unfunded Institutional Grants | $3,929 | $8,401 |
7.9%
|
| Funded Institutional Grants | $1,294 | $2,433 |
6.5%
|
| Tuition After Institutional Grants | $14,247 | $22,140 |
4.5%
|
| Educational Expenditures | $33,159 | $54,457 |
5.1%
|
| Net Assets | $188,401 | $218,944 |
1.5%
|
| Endowment | $123,975 | $164,649 |
3.6%
|
| Land, Buildings and Equipment | $63,671 | $121,414 |
6.7%
|
These findings show that average tuition and fees increased at an average annual rate of 5.4 percent. But after adjusting for rapidly increasing funded and unfunded institutional grants, net tuition increased at an average annual rate of 4.5 percent. This compares to a 2.4 percent annual change in the CPI over the same period.
The averages for all 251 schools included in the findings of the study mask a great deal of variation by school. To get a perspective of how outlying schools performed, the study also analyzed changes in net assets for the “Top 25” (top decile) and “Bottom 25” (bottom decile) in the 251-school sample.
Overall average net assets per school for the Top 25 almost doubled from $329.9 million in 2000 to $658.2 million by 2010. That growth represents an average annual increase of 7.2 percent. In comparison, the average school in the Bottom 25 dropped from $336.6 million in 2000 to $274.1 million in 2010, decreasing at an annual rate of 2.0 percent.
The
Business Officer
article points to the following differentiating characteristics for the significantly higher financial results for the Top 25 schools:
Characteristics of the Top 25 Schools
- Marginally higher tuition per FTE student
- Lower percentage of unfunded financial aid per FTE student
- Lower educational expenditures per FTE student
- Lower net tuition (tuition revenue less educational expenditures) losses per FTE student
- Greater gift revenue
- Higher investment returns
- Marginally higher net income from auxiliary operations, such as housing and food service
- Higher government grants
As a result of their higher financial results, the Top 25 schools had the wherewithal to increase their endowment and campus facilities at a faster rate. For example, the Top 25 schools increased endowment at an 8.3 percent average annual rate, compared with a 0.3 percent increase for the Bottom 25. Campus facilities increased at an average annual rate of 11.1 percent, compared with a 7.6 percent increase for the Bottom 25.
The study did not focus on the various factors that might explain why some schools are able to manage their operations in a way that leads to greater financial strength.
One explanatory factor, however, that was revealed in the study is location. Nineteen of the Bottom 25 schools are located in the Midwest or Southern Gulf states. Only four of the Top 25 are located in those regions.
The study also provides strong evidence that larger schools, in terms of FTE, generate faster net asset growth than smaller schools. Average FTE for the Top 25 schools, for example, was 7,784 compared with a lower average FTE of 2,202 for the Bottom 25. In addition, 21 of the Top 25 schools are national or regional universities. In contrast, 18 of the Bottom 25 are national or regional colleges.
A listing of the Top 25 institutions, in rank order of net asset growth, is shown in the following table.
|
Appendix
Top 25 Schools That Registered the Highest Average Annual
|
|||
|
Rank
|
School |
State
|
Average Annual % Change
|
|
1
|
Quinnipiac University |
CT
|
12.88
|
|
2
|
Emerson College |
MA
|
12.65
|
|
3
|
Chapman University |
CA
|
11.56
|
|
4
|
Marist College |
NY
|
9.84
|
|
5
|
Saint Joseph’s University |
PA
|
9.69
|
|
6
|
Villanova University |
PA
|
8.79
|
|
7
|
DePaul University |
IL
|
8.44
|
|
8
|
The New School |
NY
|
8.21
|
|
9
|
Drexel University |
PA
|
8.12
|
|
10
|
Nova Southeastern University |
FL
|
7.65
|
|
11
|
American University |
DC
|
7.58
|
|
12
|
Campbell University |
NC
|
7.53
|
|
13
|
Bard College |
NY
|
7.08
|
|
14
|
Elon University |
NC
|
6.90
|
|
15
|
Skidmore College |
NY
|
6.84
|
|
16
|
Tufts University |
MA
|
6.54
|
|
17
|
University of Denver |
CO
|
6.53
|
|
18
|
University of San Diego |
CA
|
6.35
|
|
19
|
Providence College |
RI
|
6.23
|
|
20
|
New York University |
NY
|
6.21
|
|
21
|
Luther College |
IA
|
6.01
|
|
22
|
York College Pennsylvania |
PA
|
5.89
|
|
23
|
Santa Clara University |
CA
|
5.84
|
|
24
|
Marquette University |
WI
|
5.83
|
|
25
|
Hofstra University |
NY
|
5.79
|
The complete report, issued by Chapman University’s A. Gary Anderson Center for Economic Research, may be downloaded, free of charge, from the
center’s website
.


Very impressive
work from you, your blog is sensational. Keep up the good work, thanks.
promotional
gifts ideas