Photos, video and other media tools have provided a picture of life on the ground during lockdowns necessitated by the novel coronavirus pandemic. Now Chapman University scientists are giving us a view from space to help us understand whether stay-at-home orders are succeeding.
Remote earth observations using European Space Agency satellite imagery allow the scientists to monitor how countries are responding to the COVID-19 pandemic. By tracking big declines in nitrogen oxide emissions over regions where activity is restricted, the scientists can frame the scope of change in those nations.
Less nitrogen oxide in the atmosphere means less human activity in a region
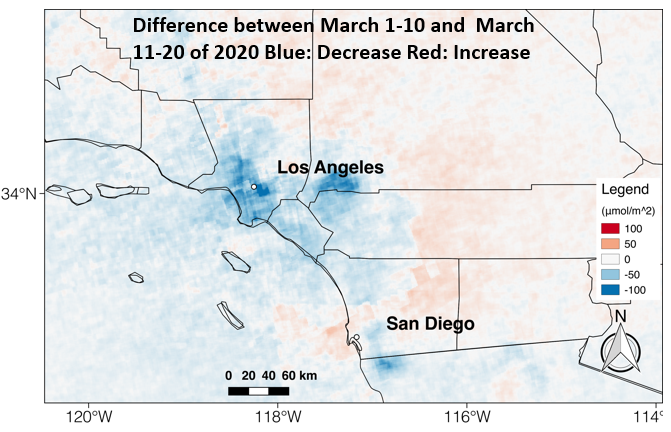
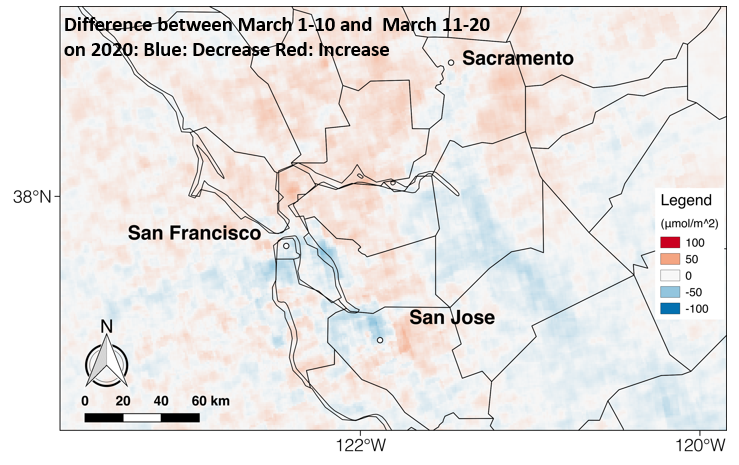
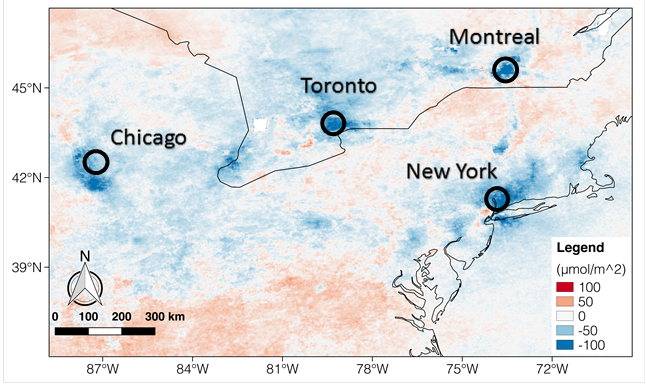
Most recently, the earth systems scientists at Chapman have started studying atmospheric images for New York and Los Angeles to see if directives for people to stay home are affecting nitrogen oxide emissions. Early images indicate strong compliance in those cities. If the satellite images display patches of dark blue, it means that emissions are down as companies close plants, people drive less and general activity is reduced to slow spread of the virus.
“If people are not responding to calls for them to stay at home, we will see it in our data,” said Hesham El-Askary, a professor at Chapman University whose Earth Systems Science Data Solutions lab is collecting and interpreting the satellite data.
El-Askary is joined on the project by Wenzhao Li, a research assistant, as well as Chapman President Daniele Struppa, a noted mathematician, and Tom Piechota, vice president for research at Chapman and an environmental engineer.
“If we’re still seeing a big emissions footprint as a proxy for traffic and other activity, then we know that people are not listening and we need to do something different,” El-Askary added.
Satellite data is helping Egyptian leaders weigh the merits of restrictive actions
Policymakers in El-Askary’s native Egypt are receiving data from the Chapman lab as they decide what actions to take in their region. The Chapman team is eager to make its findings available to leaders in other regions as well.
Among the lab’s most robust data sets is for Wuhan, China, where nitrogen oxide levels were much lower in January 2020 as compared with levels in the same month a year ago. Wuhan was essentially ground zero for the COVID-19 outbreak, and China responded by imposing strict quarantines. The action closed industrial plants, curtailed travel and otherwise reduced nitrogen emissions that come from burning fossil fuels and biomass. In February, the drop in emissions was even more dramatic.
While Wuhan has remained on lockdown, other areas of China have resumed industrial production as the coronavirus risk has lessened. Satellite images of areas where industrial plants have reopened and other activity has resumed show a spike in concentrations of nitrogen oxide.
Chapman scientists are now evaluating images for Los Angeles and New York
From Japan to Italy, North America to Saudi Arabia, El-Askary and his team can use earth systems satellite data to show what stay-at-home compliance looks like when it works, and when it is failing.
“We’re now looking at data from Los Angeles, New York and Seattle for the past five days or so, and our goal is to get a good view of whether people are complying,” El-Askary said.
Since its formation, the Earth Systems Science Data Solutions Lab at Chapman has principally tracked global progress on the United Nations’ Sustainable Development Goals, established in 2003. The goals target clean energy, air pollution, poverty, hunger, human health and a dozen other sustainability initiatives established by the UN.
By monitoring nitrogen oxide emissions over regions that have restricted activity, the Chapman lab is pivoting to employ an earth systems tool to aid the fight against a global pandemic.