In early 2023, Chapman’s Strategic Plan outlined the university’s commitment to enrich the Chapman Experience by expanding opportunities for students from underrepresented communities and pursuing formal recognition as a Hispanic-Serving Institution (HSI).
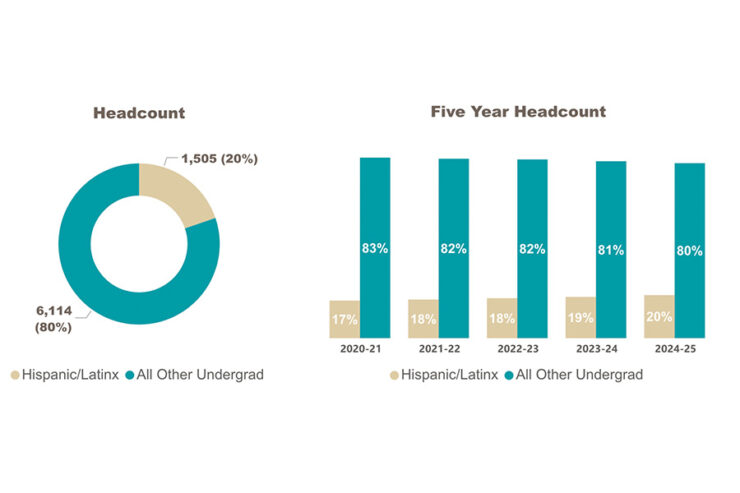
An early step in that effort was the creation of Chapman’s HSI Dashboard to monitor the university’s Hispanic/Latinx student enrollment for undergraduate degree seekers. Institutions are recognized as an HSI when they have an enrollment of 25% or more Latinx/Hispanic students.
The data within the dashboard includes multiple click-through demographics and academic and financial data points for the 2023-24 academic year, with updates for the 2024-25 academic year forthcoming after the census.
Additionally, there is a glossary of terms to help users understand the data on the bottom right corner of the dashboard.
“This dashboard is key to our efforts to become a Hispanic Serving Institution, “ says Gabriela Castaneda, Ed.D., associate vice president of diversity, equity and inclusion and director for Hispanic and Latinx achievement . “A centralized data hub makes monitoring our process in real-time transparently easier, giving our stakeholders access at their fingertips. The visual summary makes complex data more accessible and understandable.”
Users are able to disaggregate data by race/ethnicity and certain student characteristics.
For Chapman faculty and staff across the university, the data has manifold uses, including, among others:
- Grants and Research: Many grants that support research and student success require information on Hispanic/Latinx enrollment, with many requiring a minimum threshold of enrollment.
- Marketing and Audience Engagement: As the university seeks to recruit and retain more Hispanic/Latinx students, this data can help drive marketing and engagement strategies.
- Academics: Data regarding Hispanic/Latinx majors by enrollment may help inform curricular decisions, such as hiring and resource allocation.
“The dashboard consolidates data from various sources and tells a quantitative story to complement our qualitative narratives told via programs and events,” Castaneda says.