When she gazes up at sunlight as it filters through foliage, Shenyue Jia sees cool possibilities for underrepresented communities that sometimes have been left out of planning to mitigate the expanding heat effects of climate change.
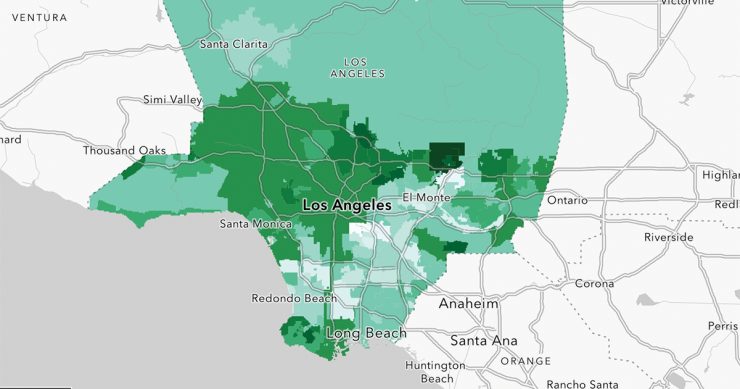
Jia, a post-doctoral researcher in Chapman University’s Center of Excellence in Earth Systems Modeling and Observations, has worked with community partners to develop an interactive map viewer, showing the existing and potential tree canopy for Los Angeles County.
The digital tool was launched in 2020 and has since been used extensively by the Los Angeles Urban Forestry Division to identify priority areas where the planting of trees can contribute to climate resilience, environmental equity and the improvement of public health.
We asked Jia, Ph.D., about her contributions to the urban greening project.
How Did You Get Involved in the Tree Canopy Effort?
My first involvement in community science came in 2015. A project funded by the L.A. Municipal Water District evaluated the effectiveness of a rebate program to incentivize residents to replace lawns with drought-resistant alternatives. Then in 2020, I became co-principal investigator collaborating with TreePeople, an L.A.-based NGO, to develop the interactive map viewer showing the tree canopy coverage. So far, the tool has led to new trees being planted in previously industrial areas, mitigating the effects of urban heat islands.
What are Urban Heat Islands?
These are areas that experience higher surface temperatures because infrastructure like asphalt and buildings absorb and re-emit the sun’s heat more than natural landscapes do. These are often low-income areas, close to freeways, which also means they have poor air quality. To alleviate these effects with urban greening, we first have to identify areas of greatest need. That’s where the tree canopy map becomes an especially useful tool.
What Expertise Did You Bring to the Tree Canopy Project?
As a remote sensing specialist, I work at the convergence of ecology and geographical information systems (GIS). For this project, we processed information such as state-of-the-art satellite images and air-quality data, but that’s only the first part. It’s condescending to only use technology to decide where to plant trees. So partners like TreePeople and the Center for Urban Resilience at Loyola Marymount University helped increase community involvement. In each city, there was a “tree summit” and a survey
so residents could help with decision-making. Should we plant near senior centers? At bus stops? Everyone wanted to take those local voices seriously and involve them in the model.
Are You Able to Evaluate the Project’s Impact So Far?
It’s hard to measure because the first plantings are only two years old, so the trees will need time to produce more shade. But we’re encouraged by the progress.
The work is ongoing in five cities, and there are new efforts underway. We secured funding from Edison International to add more functionality to the map viewer tool, and we have a proposal out to Cal Fire to expand the project into Ventura County.
What Are the Personal Rewards of Contributing to a Community Science Effort Like This?
I’m thrilled to see the application penetrate all the levels and reach communities that might otherwise have been left
behind, and I’m eager to find more opportunities to join in community projects. It’s a great way to build bridges that solve important problems and make people’s lives better.