You know Facebook — photos, post-sharing and “likes.” But Facebook’s uses go far beyond its original design as a social networking site, say Chapman University researchers using data from Facebook’s geolocation option to help first responders and policy makers prepare for future disasters.
Shenyue Jia, Ph.D., and her colleagues at Chapman’s Center of Excellence in Earth Systems Modeling and Observations (CEESMO) have teamed up with Facebook’s Data for Good initiative to investigate how people behave in disasters. The project aims to use the platform’s Disaster Maps to find patterns of human behavior during crises, information that can help decision makers deploy resources.
Facebook’s Data for Good initiative collaborates with researchers to investigate how social ties influence human behavior.
Disaster Maps records population changes using geolocation data collected from users who allow the location-sharing service while using the Facebook App, or from the voluntarily-reported data through Facebook Safety Check.
These maps give insight into how different populations react over time when mandatory evacuations are placed or lifted.
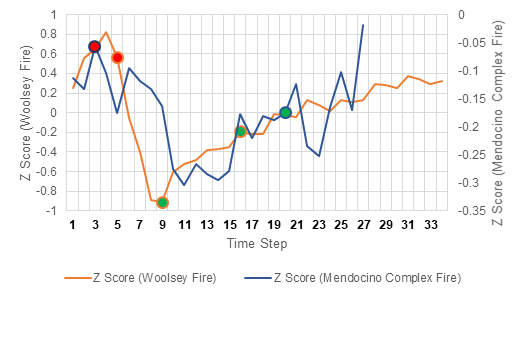
“We found that the tipping points of population change seen from Facebook align well with the official announcements of placing and lifting of evacuation orders,” says Jia. “The number of regular Facebook users dropped immediately and fast after a mandatory evacuation order was announced regardless of which neighborhood we looked into.”
Helpful Findings
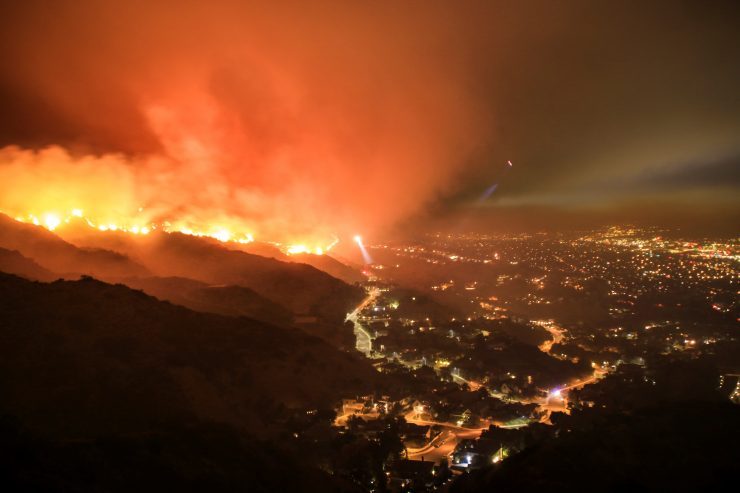
The CEESMO team looked at Facebook data from two of the deadliest wildfires in California history: the 2018 Mendocino Complex Fire and the 2018 Woolsey Fire.
Using the Facebook data, the team identified clusters of population at different times throughout the disaster. Clusters with more Facebook users were “hot spots,” and suggested a higher population concentration while clusters with fewer users were “cold spots,” and suggested a lower population.
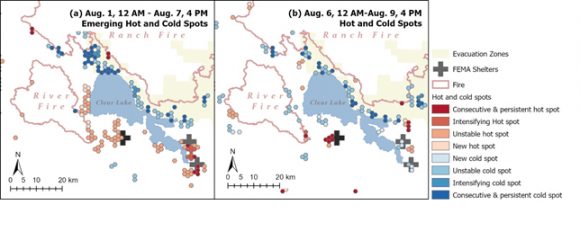
CEESMO’s findings showed that FEMA shelters were often identified as “hot spots” during the Mendocino Complex Fire, meaning that a higher population clustered in shelters as compared to adjacent neighborhoods.
Surprisingly, FEMA shelters were not universal hot spots.
Jia’s team found that if a fire occurred in a more populated area, as in the case of the Woolsey Fire, FEMA shelters did not appear to be “hot spots” as compared to other nearby areas.
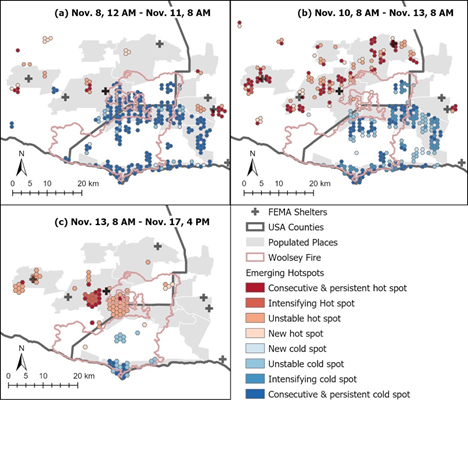
In more populated areas, displaced people have more evacuation options and staying at a shelter may be their last choice.
Studies have shown that many Americans live close to social support systems and it’s natural for individuals to seek accommodation within those networks when they are displaced during a major disaster.
During the Woolsey fire, several nearby communities outside the fire perimeter experienced a short-term increase in population. Such ambient increase was parallel to the significant drop of population near Thousand Oaks in response to the evacuation order.
These research findings have implications for evacuation planning and suggest that having FEMA shelters could be less critical when preparing for a disaster close to extensive human settlement.
The Limitations of Facebook Data
While Facebook’s data provides key insight into how individuals respond during a disaster, Jia and her colleagues are the first to admit that this data has limitations.
“Due to Facebook’s different popularity among age groups, it provides a biased sampling tilted towards the younger population,” says Jia. “Millennials are better sampled than any other age groups, while baby boomers are greatly underrepresented in this dataset.”
Facebook data may accurately reflect the overall trend of population change but other metrics describing social and environmental vulnerability are needed if Facebook Disaster Maps were employed to advise the actual practice of disaster relief.
Data For Good
Social media has initiated a new era of social sensing to detect and record human behaviors that is cost-effective and easy-to-function.
“Despite the limitations on representation, Facebook Disaster Maps have shown great potential to deliver timely data for first response and disaster relief practices,” says Jia.
CEESMO’s research may help develop more meaningful derivatives to help first-response efforts.
In the future, the team aims to answer more specific questions such as which communities are less motivated to evacuate and what are the shared characteristics of places people prefer to stay during an emergency.
The team will continue its collaboration with Facebook’s Data for Good initiative and the global community of its users to find ways to use big data for social good.
Jia received her Ph.D. from UCLA Department of Geography. She’s an enthusiast of geospatial technology and has shared her knowledge on using GIS to analyze and solve real-world problems during the open house of Chapman Tech Hub and Summer Academy on Teaching by Institute for Excellence in Teaching and Learning (IETL).
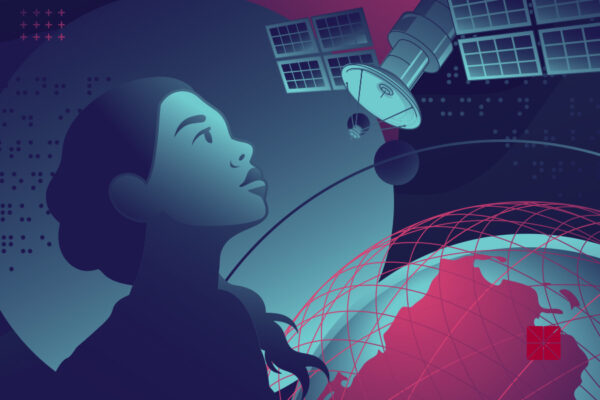
Display image at top/Getty Images